U.S. Home Prices Ticked Up 0.2% in August
- U.S. home prices rose 0.2% from a month earlier in August on a seasonally adjusted basis.
- On a year-over-year basis, home prices rose 3.1%, the slowest rate recorded in Redfin Home Price Index (RHPI) data going back to 2012.
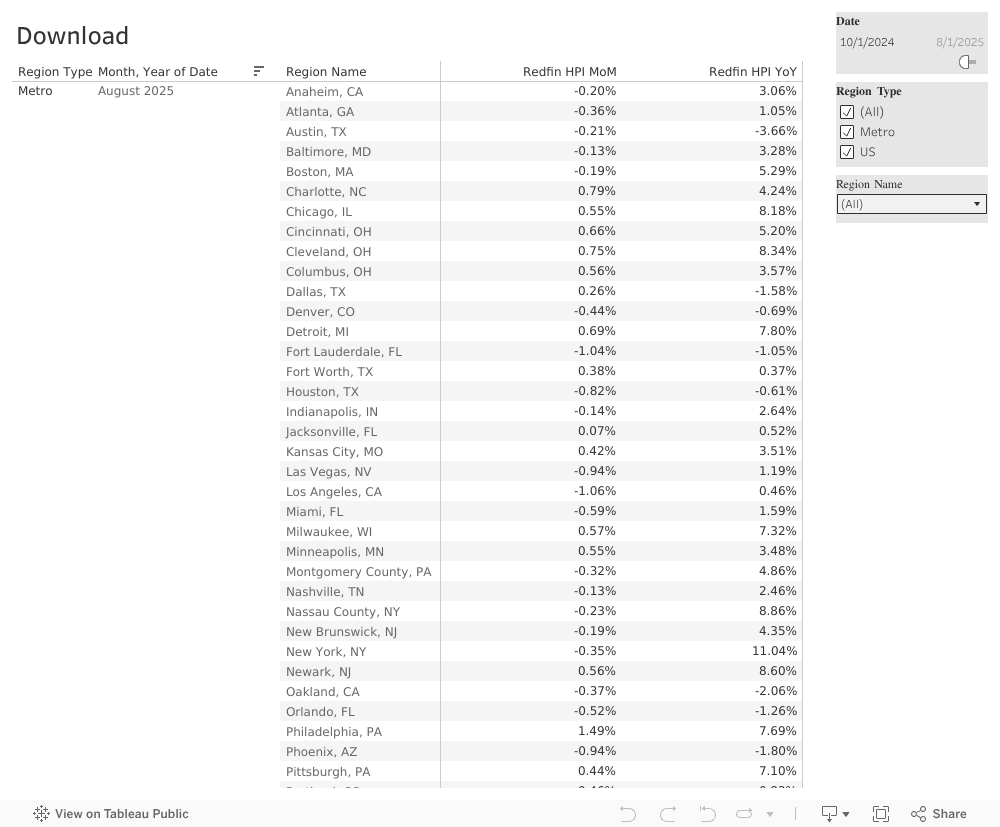
- 26 of the 50 most populous U.S. metros saw month-over-month price declines.
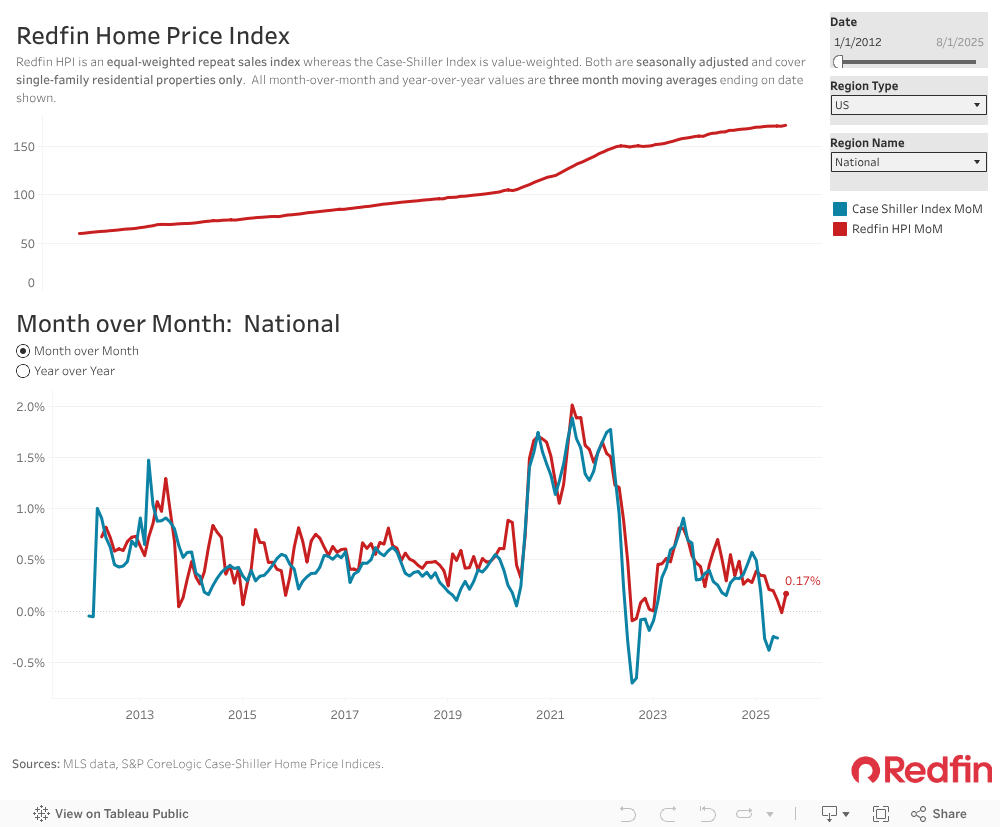
U.S. home prices rose 0.2% from a month earlier in August on a seasonally adjusted basis, up slightly from the 0.0% monthly growth rate posted in July. August marks the first time since January that the rate of home-price growth increased compared to the prior month.
On a year-over-year basis, home-price growth slowed to 3.1%, the lowest rate recorded in Redfin Home Price Index (RHPI) data going back to 2012.
var divElement = document.getElementById(‘viz1758569814542’); var vizElement = divElement.getElementsByTagName(‘object’)[0]; if ( divElement.offsetWidth > 800 ) { vizElement.style.width=’1000px’;vizElement.style.height=’850px’;} else if ( divElement.offsetWidth > 500 ) { vizElement.style.width=’1000px’;vizElement.style.height=’850px’;} else { vizElement.style.width=’100%’;vizElement.style.height=’1450px’;} var scriptElement = document.createElement(‘script’); scriptElement.src = ‘https://public.tableau.com/javascripts/api/viz_v1.js’; vizElement.parentNode.insertBefore(scriptElement, vizElement);
This is according to the Redfin Home Price Index (RHPI), which uses the repeat-sales pricing method to calculate seasonally adjusted changes in prices of single-family homes. The RHPI measures sale prices of homes that sold during a given period, and how those prices have changed since the last time those same homes sold. It’s similar to the S&P Cotality Case-Shiller Home Price Indices, but is a month ahead. August data covers the three months ending August 31, 2025. Read the full RHPI methodology here.
Home price growth slowed this year as inventory returned to pre-pandemic levels, while would-be homebuyers remained on the sidelines due to near-record prices, elevated rates and economic uncertainty. With buyer demand remaining low, sellers also recently started backing off; the number of sellers declined in July for the first time in two years.
“The tug-of-war in today’s housing market may actually be creating an opening for both buyers and sellers,” said Redfin Senior Economist Sheharyar Bokhari. “With more inventory available, intense bidding wars are in the rearview mirror, so buyers have room to negotiate. At the same time, sellers who price their homes realistically are still finding buyers, and overall, prices are holding steady. This middle ground could leave a window of opportunity open for both sides.”
Metro-Level Summary: Redfin Home Price Index, August 2025
Home prices fell in 26 of the 50 most populous U.S. metro areas on a seasonally adjusted basis in August, month over month. The biggest decline in August was in San Diego (-1.4%), followed by Los Angeles (-1.1%) and Fort Lauderdale, FL (-1%). Prices increased most in San Francisco (1.5% month over month), Philadelphia (1.5%) and Charlotte (0.8%).
On a year-over-year basis, prices in New York (11%) rose the most, followed by Nassau County, NY (8.9%) and Newark, NJ (8.6%). Prices fell the most in Austin, TX (-3.7% year over year), Tampa, FL (-3.5%), and Oakland, CA (-2.1%).
var divElement = document.getElementById(‘viz1758569854477’); var vizElement = divElement.getElementsByTagName(‘object’)[0]; if ( divElement.offsetWidth > 800 ) { vizElement.style.width=’1000px’;vizElement.style.height=’850px’;} else if ( divElement.offsetWidth > 500 ) { vizElement.style.width=’1000px’;vizElement.style.height=’850px’;} else { vizElement.style.width=’100%’;vizElement.style.height=’1450px’;} var scriptElement = document.createElement(‘script’); scriptElement.src = ‘https://public.tableau.com/javascripts/api/viz_v1.js’; vizElement.parentNode.insertBefore(scriptElement, vizElement);
The post U.S. Home Prices Ticked Up 0.2% in August appeared first on Redfin Real Estate News.
Categories
Recent Posts